Here we go with the 9th week of #WorkoutWednesday and Rody’s back for another challenge. Let’s get to it.

Requirements
- Show the difference between White and Minority Players as a percent of Total Players by year
- Shade the Area between the two lines Grey
- When hovering over a year, the labels for White and Minority players will appear
- *BIG ONE* You can hover any above, between or below the Two Lines to trigger the dashboard action.
Okay so this looks like it’s gonna be a bit out of my league but I’ll give it my best nonetheless.
First, I’m going to do all the things I know I can do:
- Create a group for the two ethnicities
- Create the line graph
- Constant ref. line at 2004
- I’ll wait to annotate the line until I’m in the dashboard because I’ve learned that things don’t quite match up quite right.
- Sheet formatting
- Mark label set to show on highlight
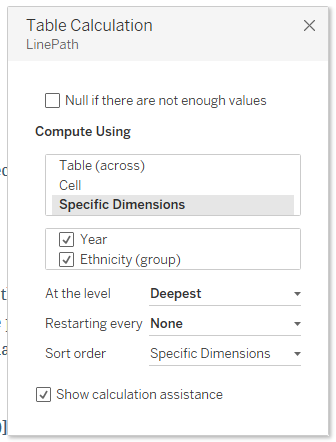
Now for Rody’s second bullet point, I’ve never done this but I know that Rody has a blog post about it. You should check it out if you haven’t already. In it, he provides the calculation as well as what Tableau is doing in the background to make this work. I need to create a [LinePath] field:
IF MIN([Ethnicity (group)])=WINDOW_MAX(MAX([Ethnicity (group)]))
THEN INDEX()
ELSE SIZE() + (SIZE()-INDEX())
END
When I drag that field on the Path card, I need to edit the table calc to have calculate using both [Year] and [Ethnicity (group)]
And this is where I am so far
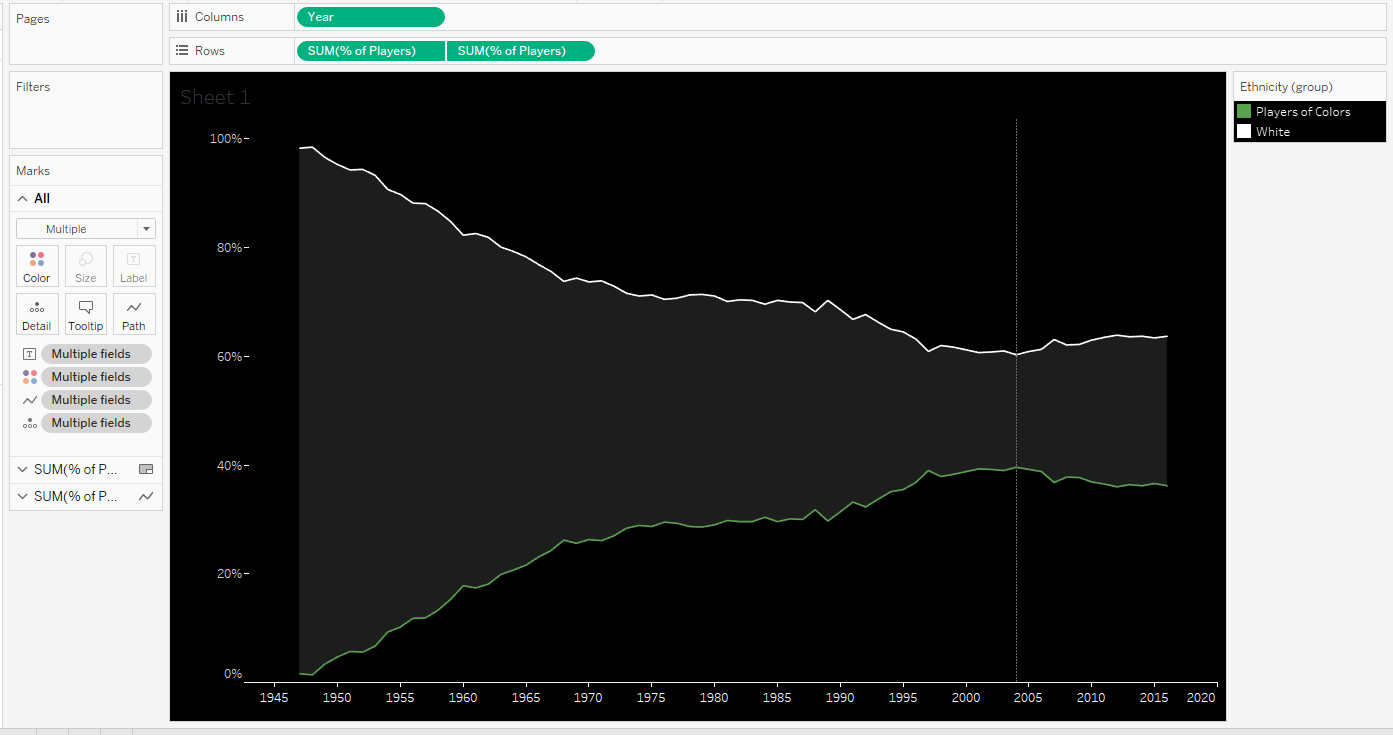
and here (you can’t tell from the screenshot, but I assure I’ve filled in between the lines)

Now for the real challenge of the week. Rody wants us to create a way that triggers the hover action regardless of where you point you mouse on viz. This is challenging because the current state is you have to hover on the lines or the polygon to fire the action. Hovering in the black, does nothing.
Now looking at Rody’s interactive version on Tableau Public, I can see that it appears as though there’s something happening to make four marks appear with a tooltip for year. Now, I have not idea how he’s done this but here are some best educated guesses in the order they came to me.
- Did Rody create some sort of set or boolean to check the polygon calc against to see if the values were inside or outside the min and max for each year? This would create a 2 member dimension which we could color black for out/False and gray for in/True
- Is there a line for each year going from 0-100%? Probably not because you be able to see if those lines in the viz
I’m stumped to be honest. I need to break open Rody’s workbook and look under the hood.
Holy crap! I my first idea was pretty close, conceptually, to what Rody did. In fact, Rody didn’t use any Table calcs at all. He created three new measures and filled in the spaces as a area charts. That makes sense. This just goes to show that I should trust my instincts and not give up so easily.
So with that little nugget of knowledge, let’s get back to completing the challenge.
It should be noted that I simply PEAKED under the hood of Rody’s workbook to see the structure. I did not look at any calculations. So the remainder of this post is still my thoughts
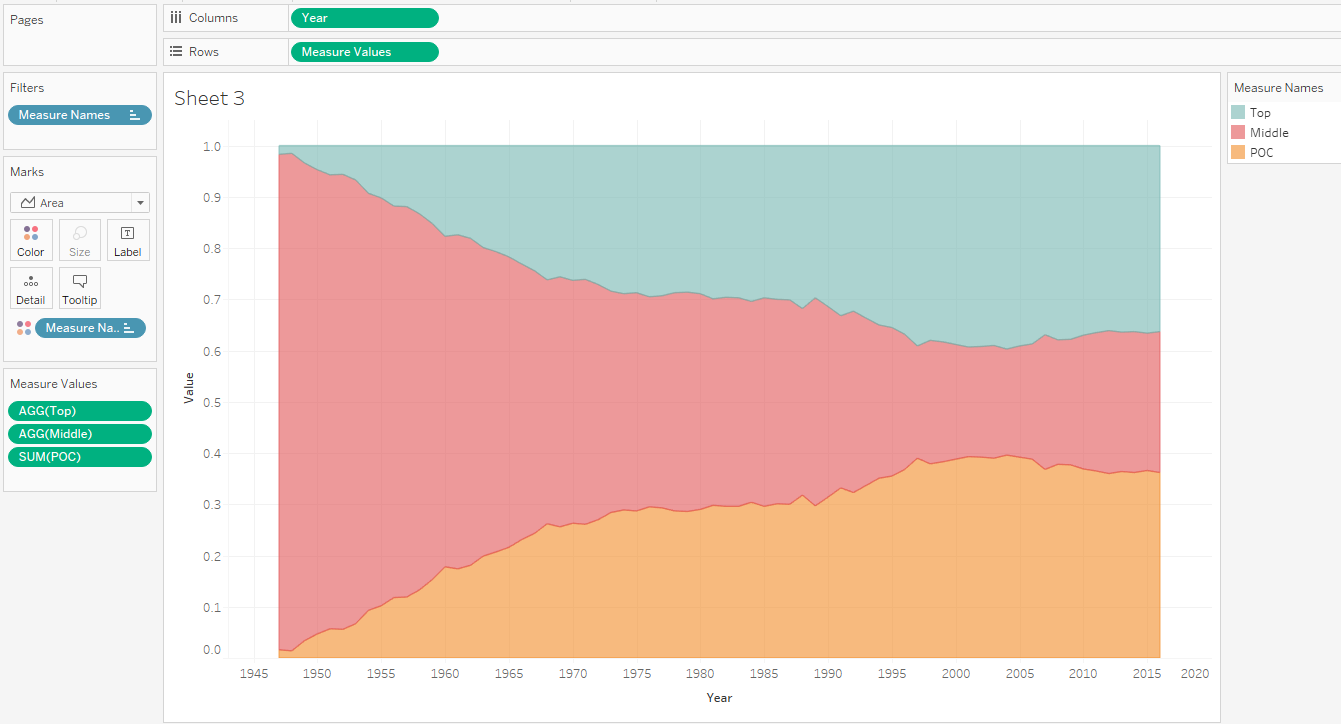
I think I want to create three different calculations and then use measure names/values as one axis to get the area charts to match up. This is straightforward. I’ll create a measure calc for each group to return their value
[White Player]
IF [Ethnicity (group)]=”White” THEN [% of Players] END
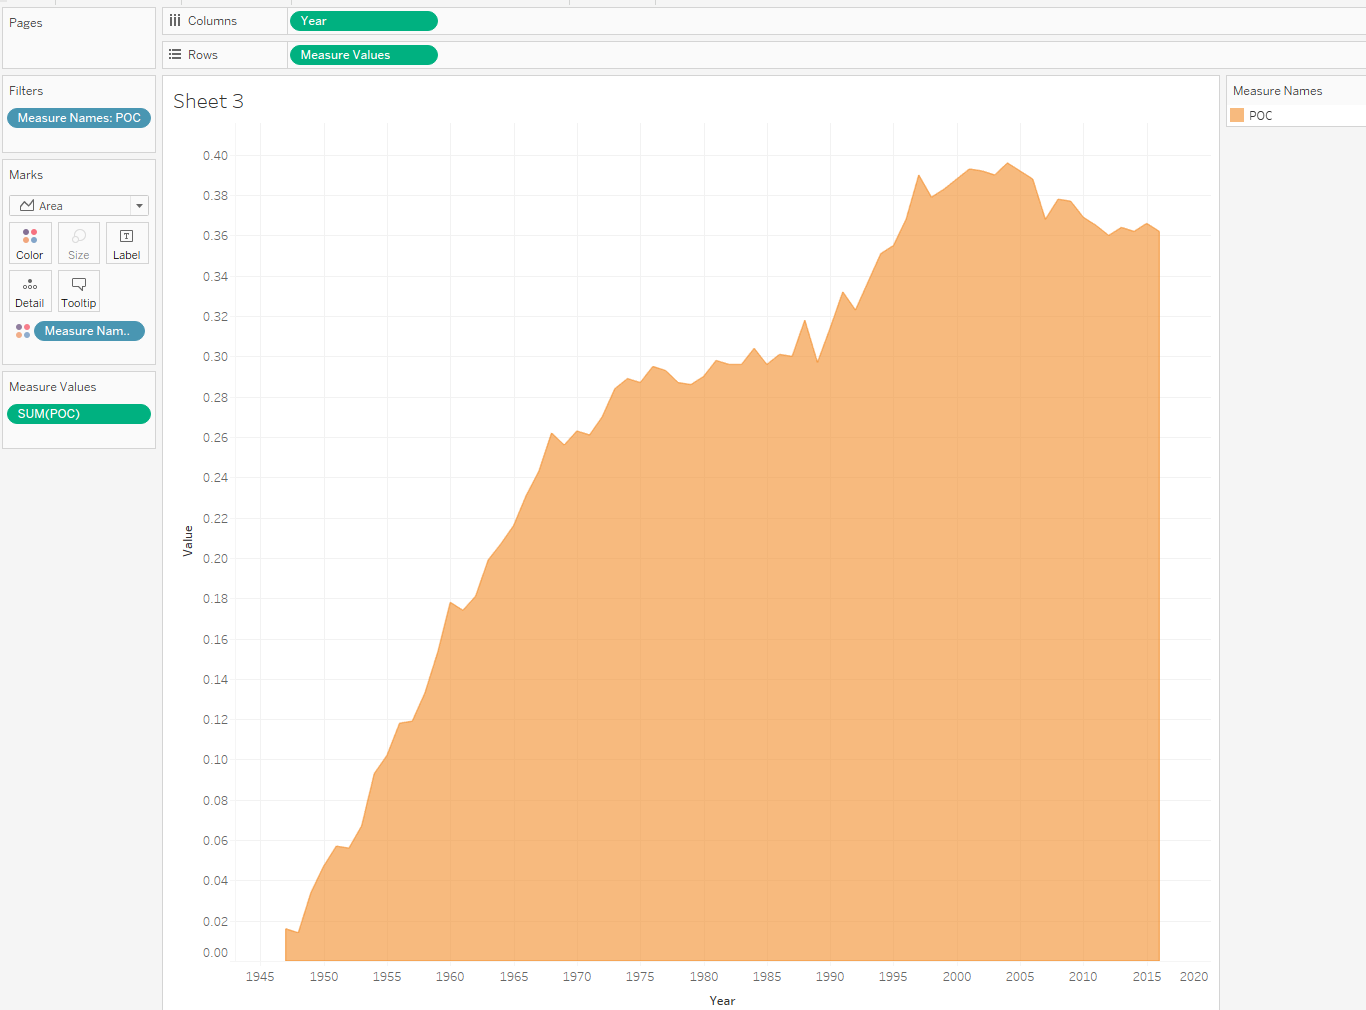
[POC]
IF NOT [Ethnicity (group)]=”White” THEN [% of Players] END
The lower area will just be [POC]
for the [Middle] I’ll take the positive difference between the values of the two groups
SUM([White]) – SUM([POC])
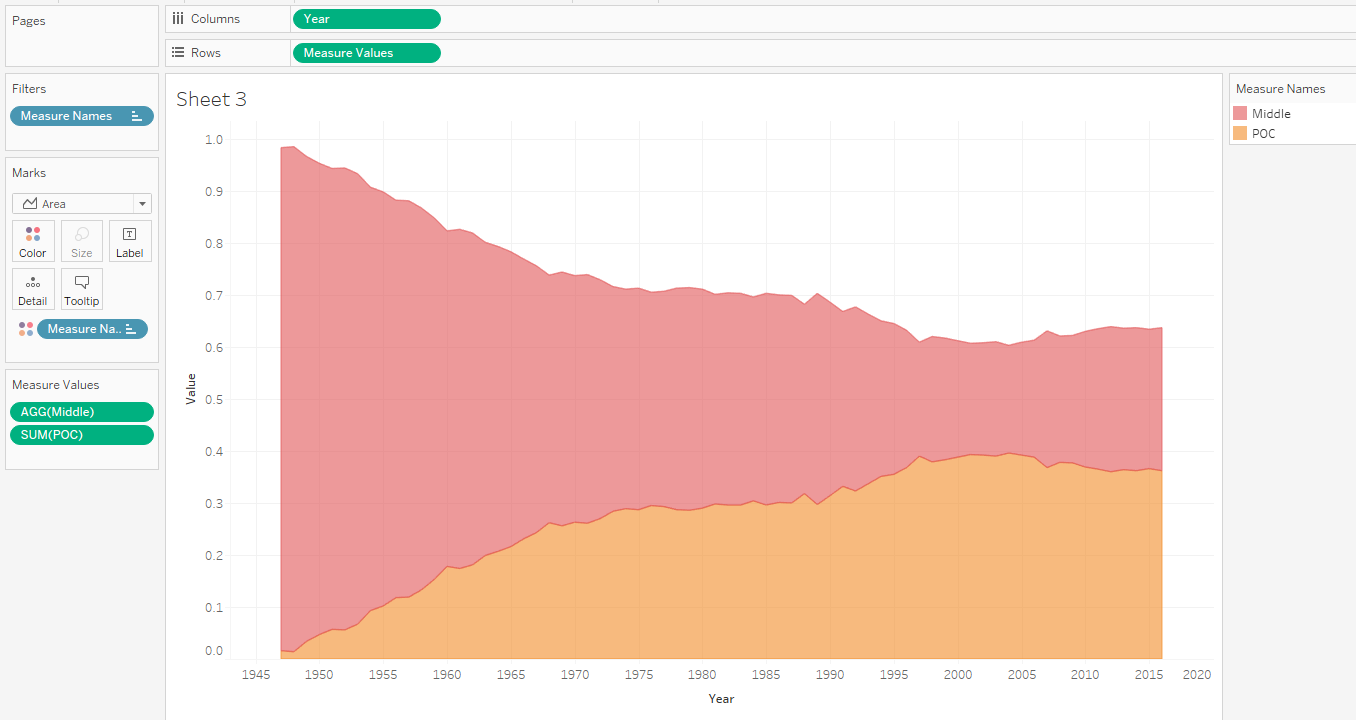
One the of the great things about Tableau’s interface is the ease at which a develop can change the order in which dimensions are displayed in the visual. For example, when I first dragged [Middle] into the Measure Values card, I get to choose what order I want things. For this, I want [POC] on the bottom, so I drag [Middle] and drop it above the [POC] pill. If I change my mind, I can just drag and drop to rearrange the order. Super simple!
You can see where this going by now, the last step is calculate the difference from 100% to the [White] value for the [Top] of the area chart
1-SUM([White])
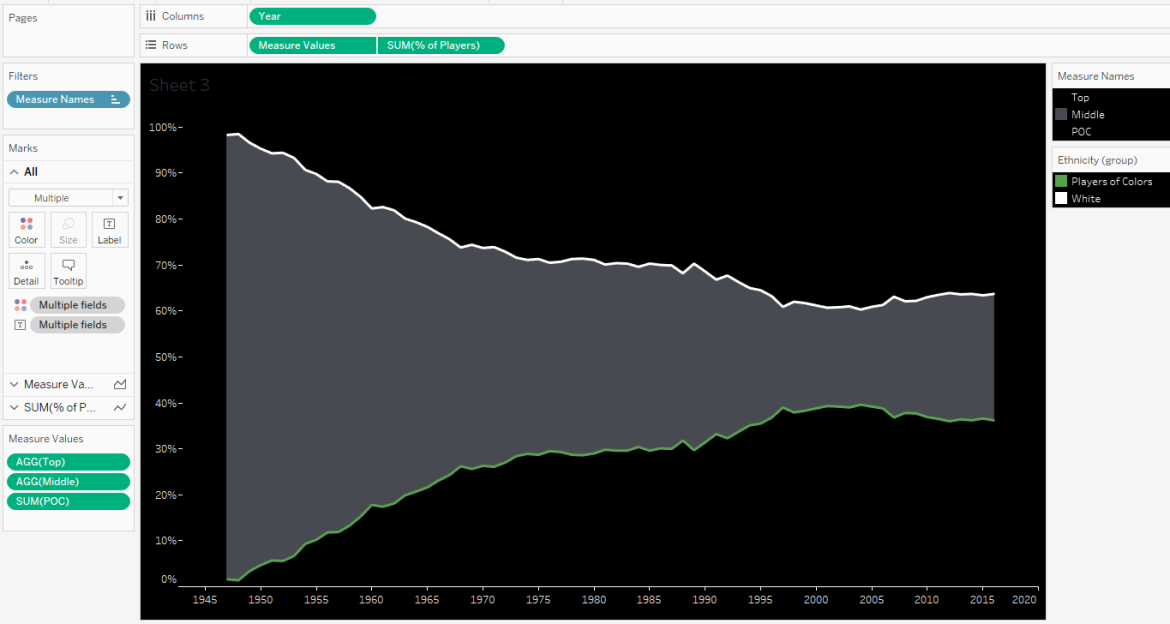
Awesome! Now let’s do the second axis for the lines for our two ethnicity groups

This is looking good. Let’s do some formatting
- Dual Axis
- Synchronize
- Edit Measure Names Colors
- Top & POC get black
- Middle gets gray
- Edit Ethnicity colors
- White is white
- POC is green
- Sheet color is black
- Remove all gridlines
- Remove borders
- Remove axis ruler for rows
- Format axes text and ticks to white for rows and columns
- Format axis ruler for columns to white
And I’ve got this
Can’t forget the constant reference line at 2004
Throw this puppy in a dashboard, annotate 2004, add the title, add the subtitle and lastly create a dashboard highlight action to activate on hover for all fields.
BOOM! DONE!
Click the screenshot for the interactive version
