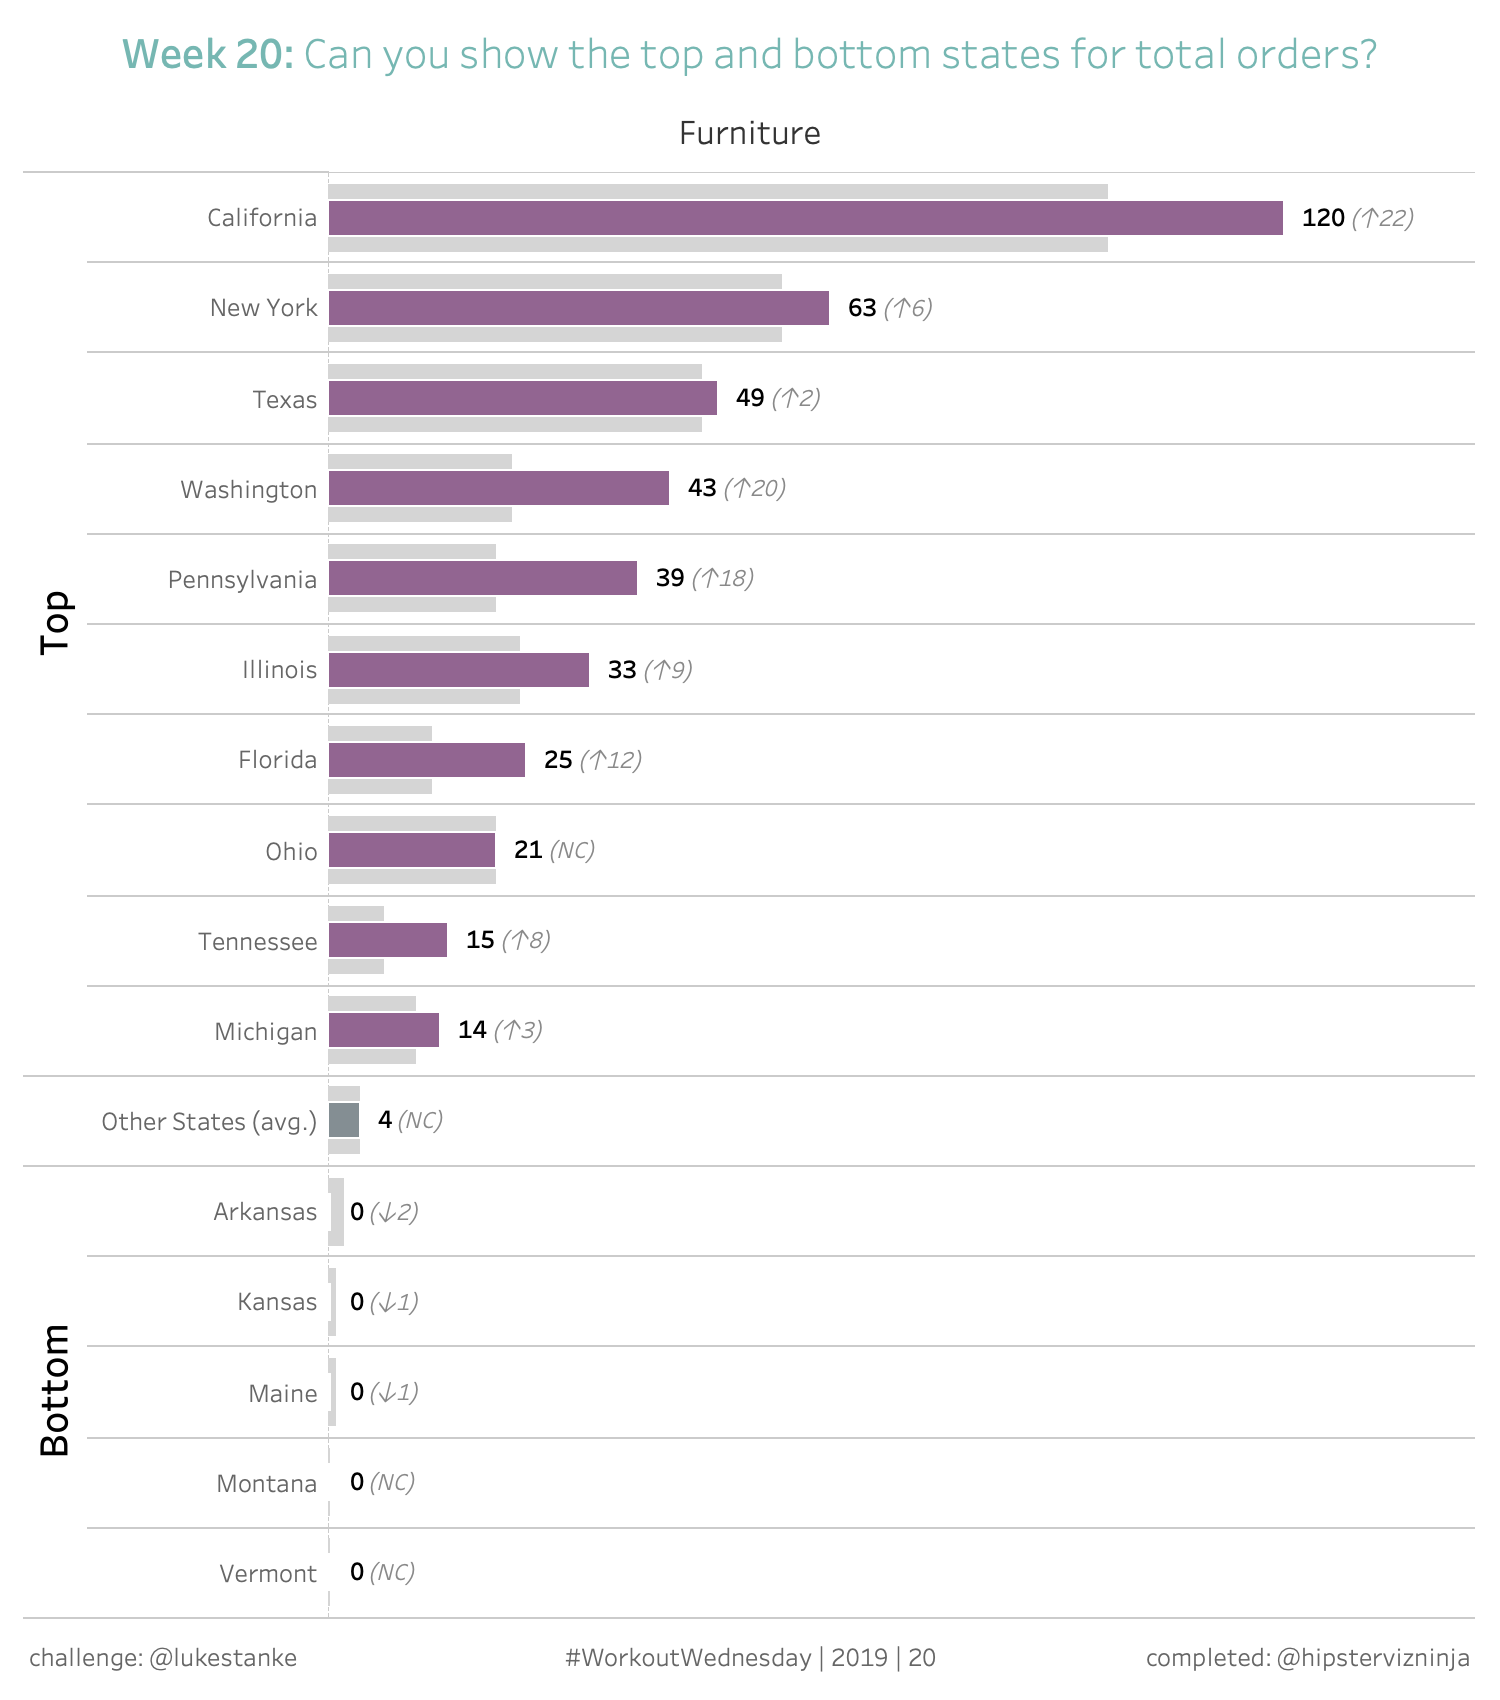
Recently the #WorkoutWednesday crew (Luke and Ann) had the pleasure of doing a #WorkoutWednesdayLIVE event for a couple different user group meetings. Luke created this challenge to take on the road.
This week's #WorkoutWednesday2019 : can you show the top and bottom (and middle) states by total? A fun little real-life challenge.https://t.co/EYuP09MEuK pic.twitter.com/ThQh0AKRUk
— Luke Stanke ? (@lukestanke) May 15, 2019
I really like this challenge and it didn’t take very long. I’m going to try something different before we get to the technical portion of this post. It’s what I do before I begin any WoW challenge. Break it down into manageable pieces. Let’s take a look at the final product and make a list of what I recognize. This list will help me get started during the build.
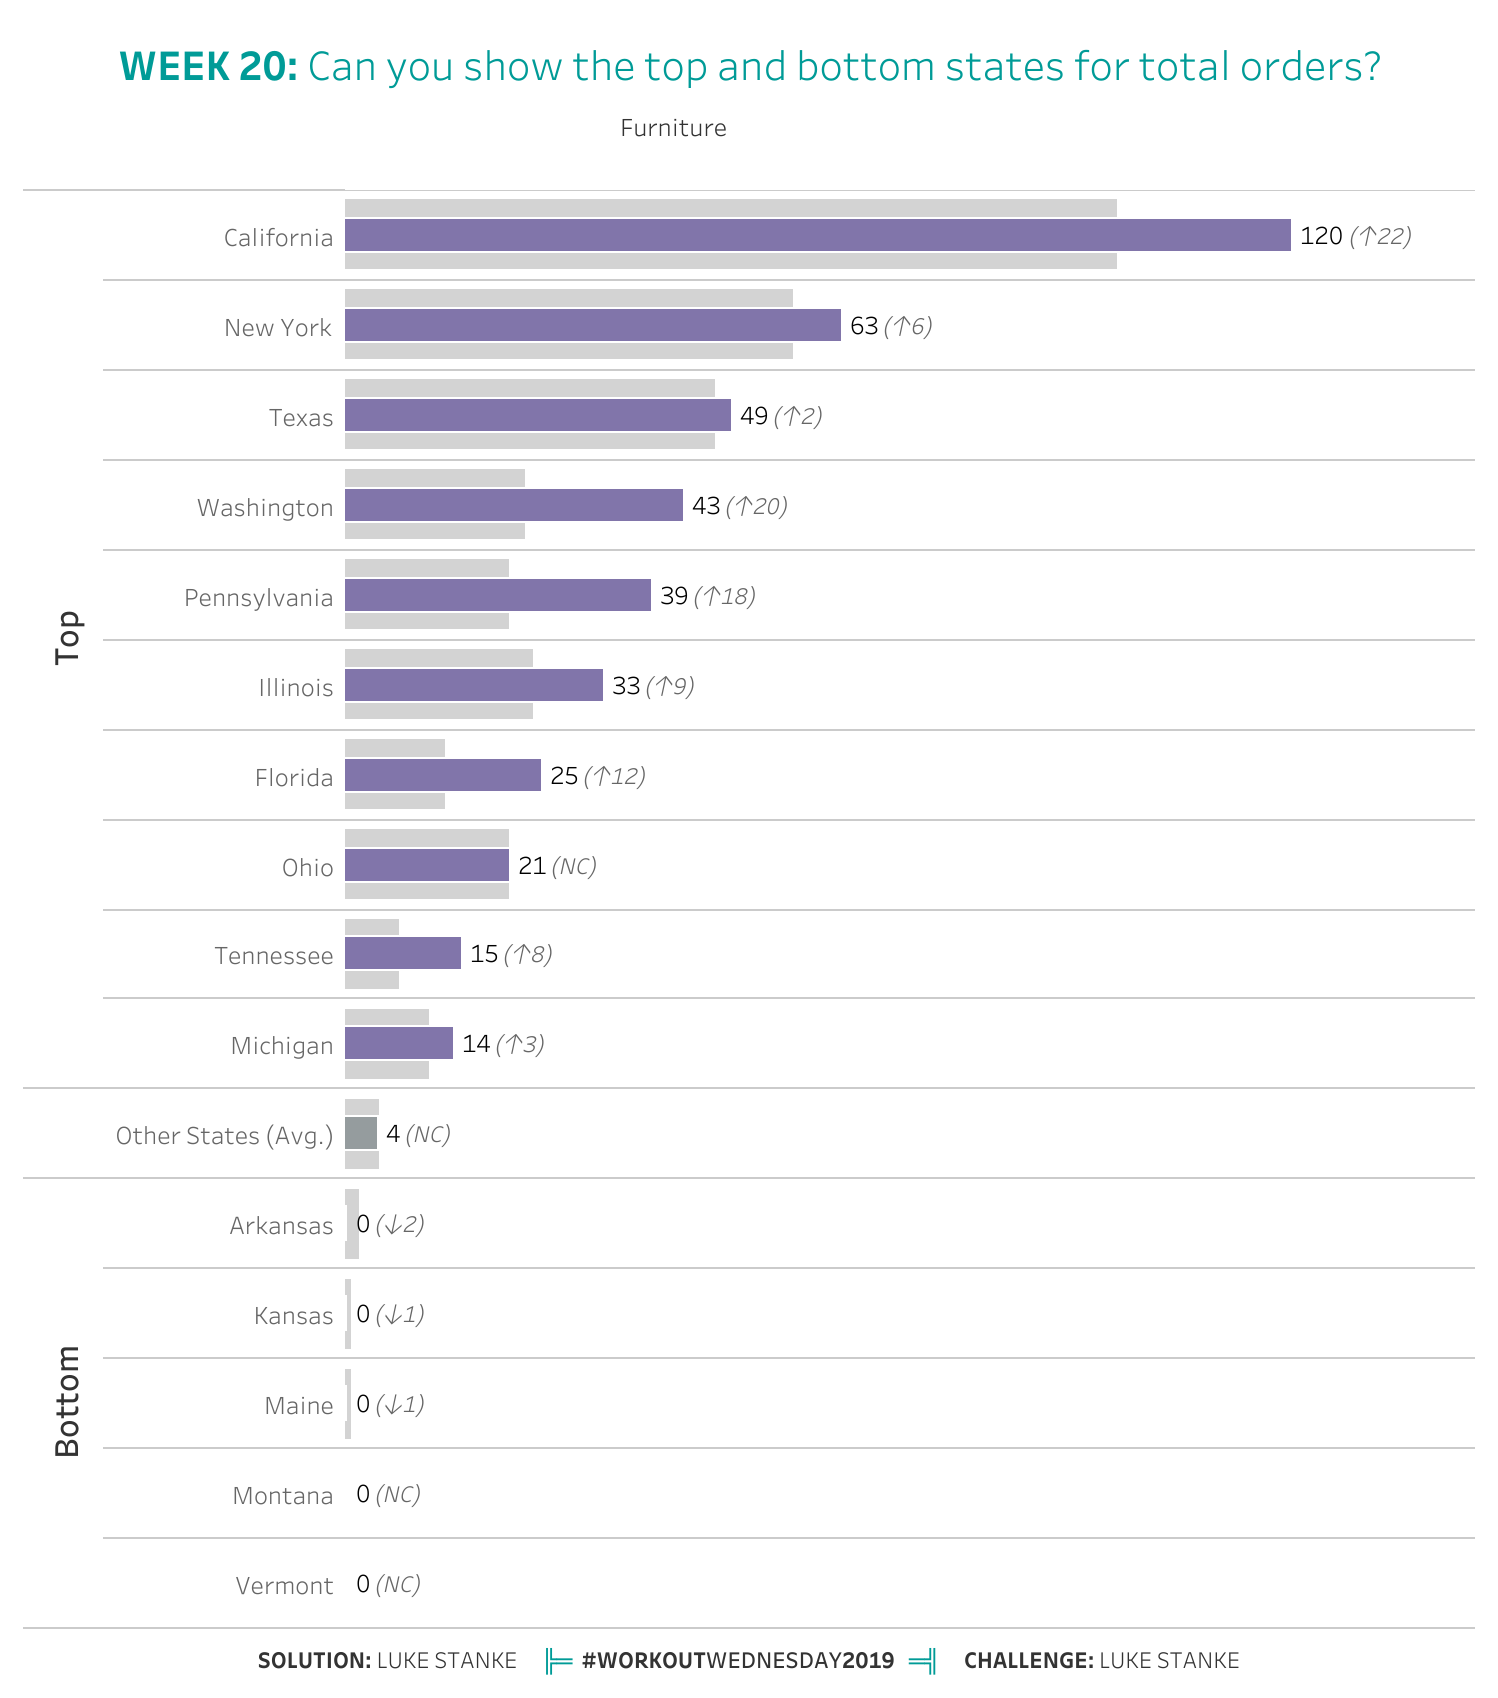
- Okay, right off the bat, I see top and bottom and any time I see this I immediately think of Sets.
- Next up is the chart type is a bar in a bar
- This could be measure name/values or dual axis
- I see custom mark labels and no axis
- That “Other States” row is throwing me off because I know that I can do combined sets but not in this way…I’ll have to think about this one
- Filter on Subcategory
- If I use sets it’s important to remember that dimension filters happen AFTER set filters so I’ll need to manipulate the order of operations by adding this dimension filter to context
I think that’s it…for now
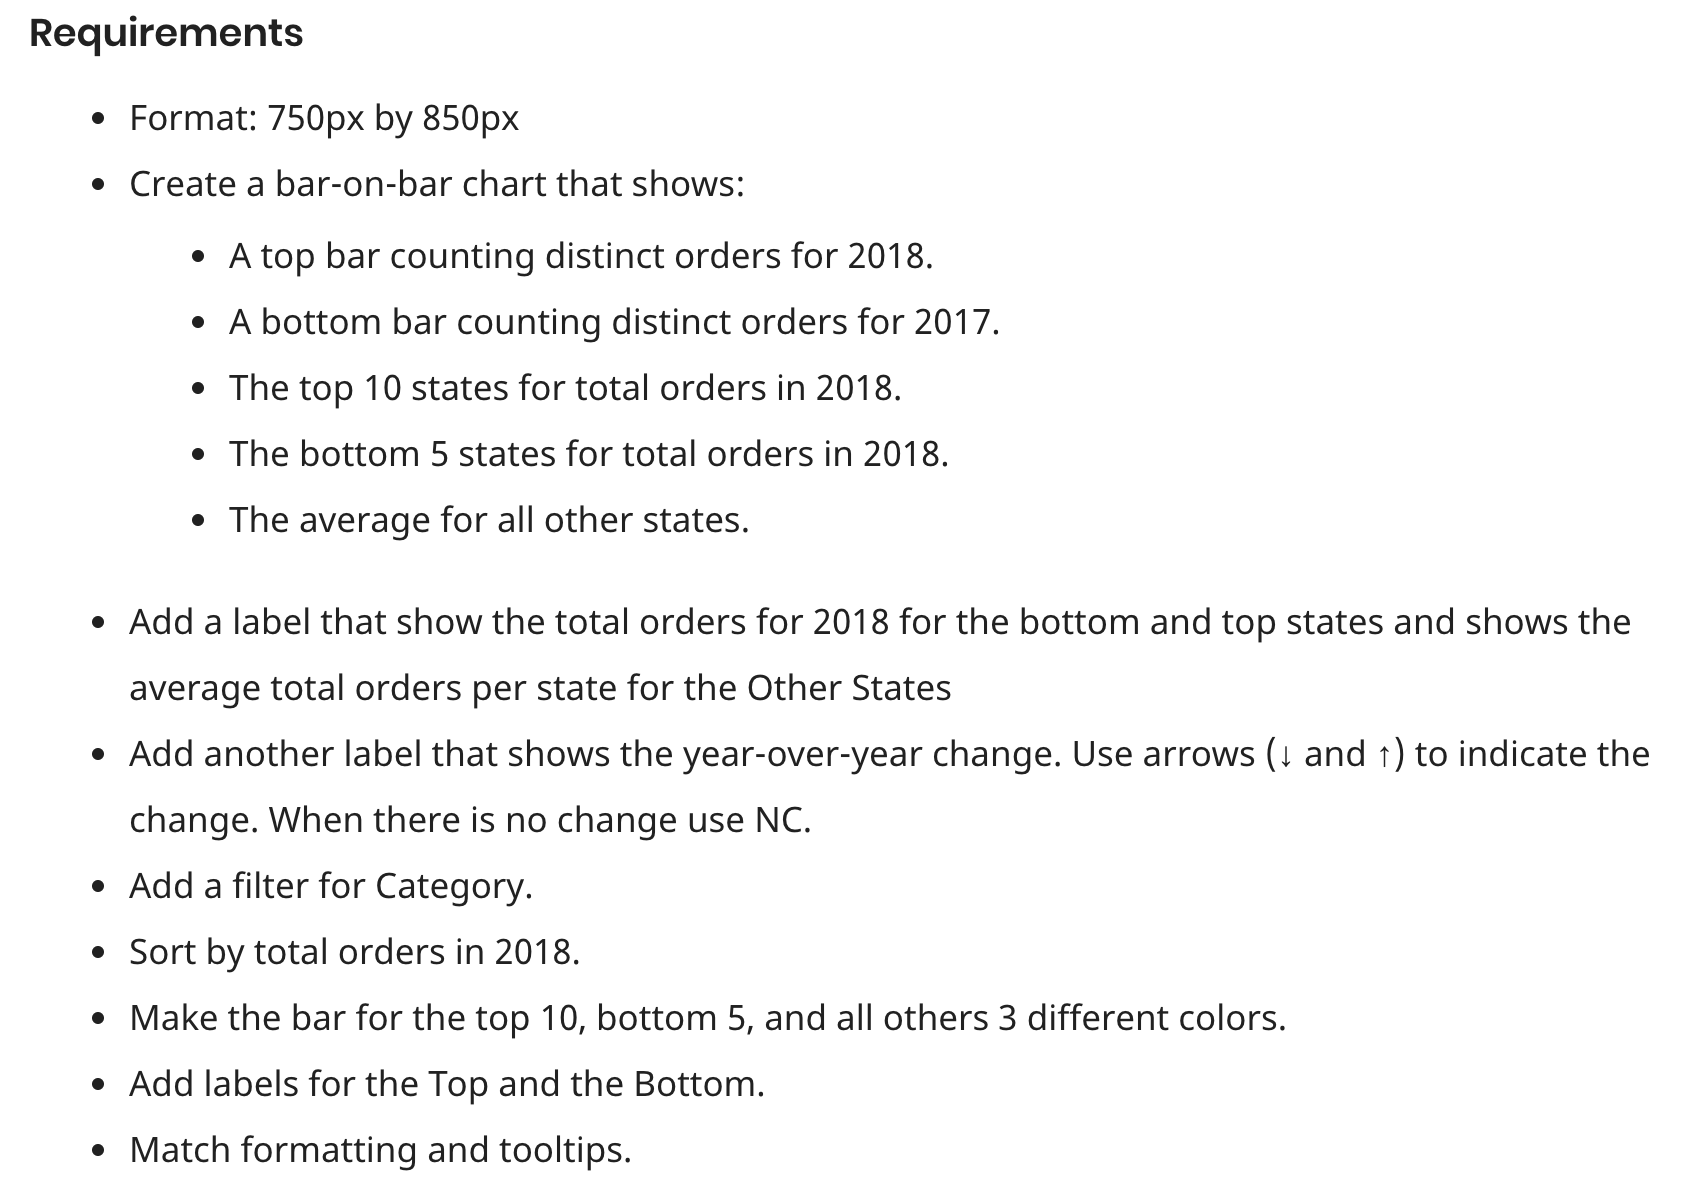
Let’s take a look at the requirements now
Alright, here we go!
The first thing I’m going to do is set up my top and bottom sets. Now we can see in the requirements that 2018 is factor used in our sets. Sets are really powerful.
A set is a new dimension that groups dimension members based on some condition, be it an aggregation or a list
There are so many options for setting up your set but for our purposes we’re going to use the a top/bottom set based on a formula
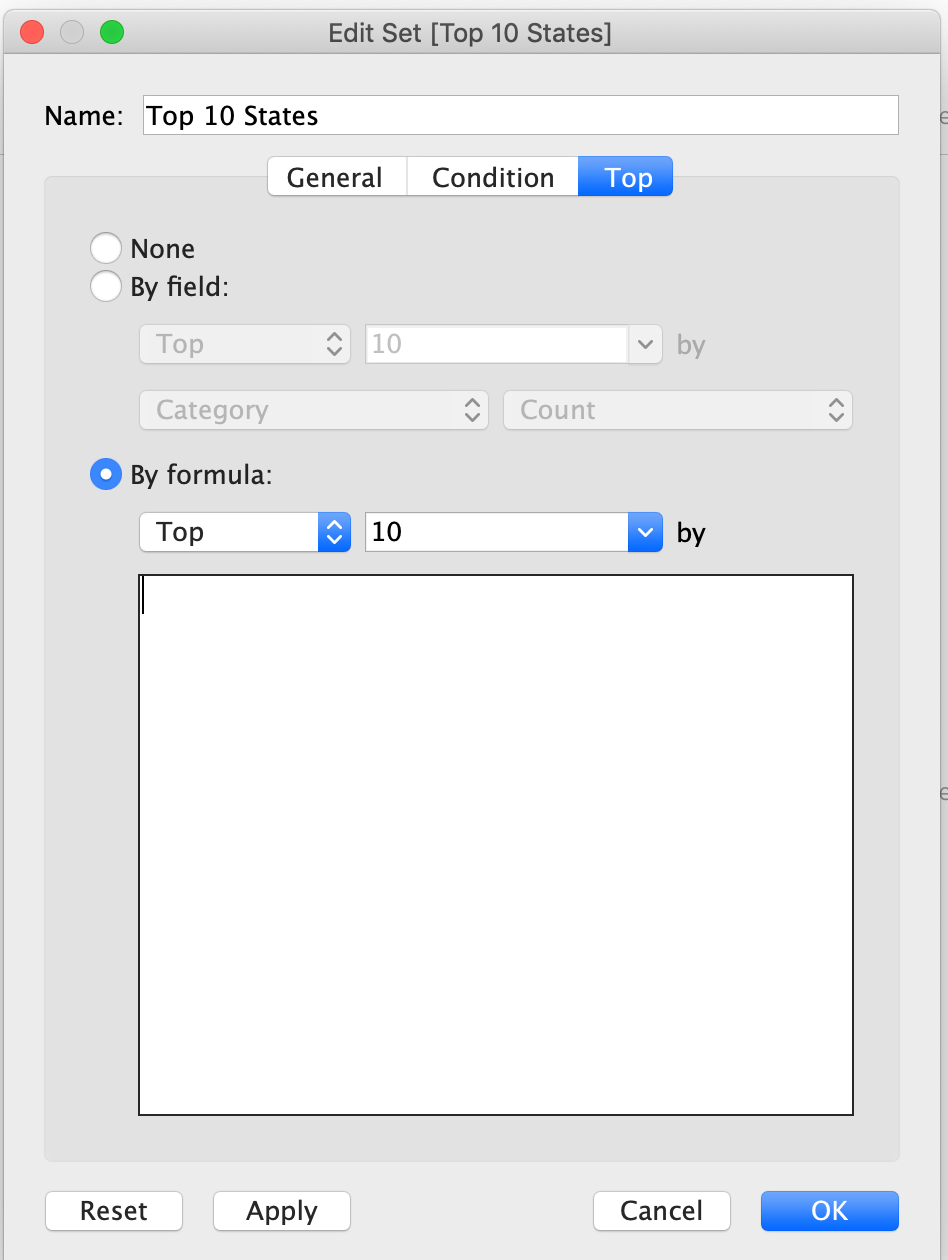
We need to isolate only the orders from 2018 and we can achieve that with the following calculated field:
COUNTD( IF YEAR( [Order Date] ) = 2018
THEN [Order ID]
END )
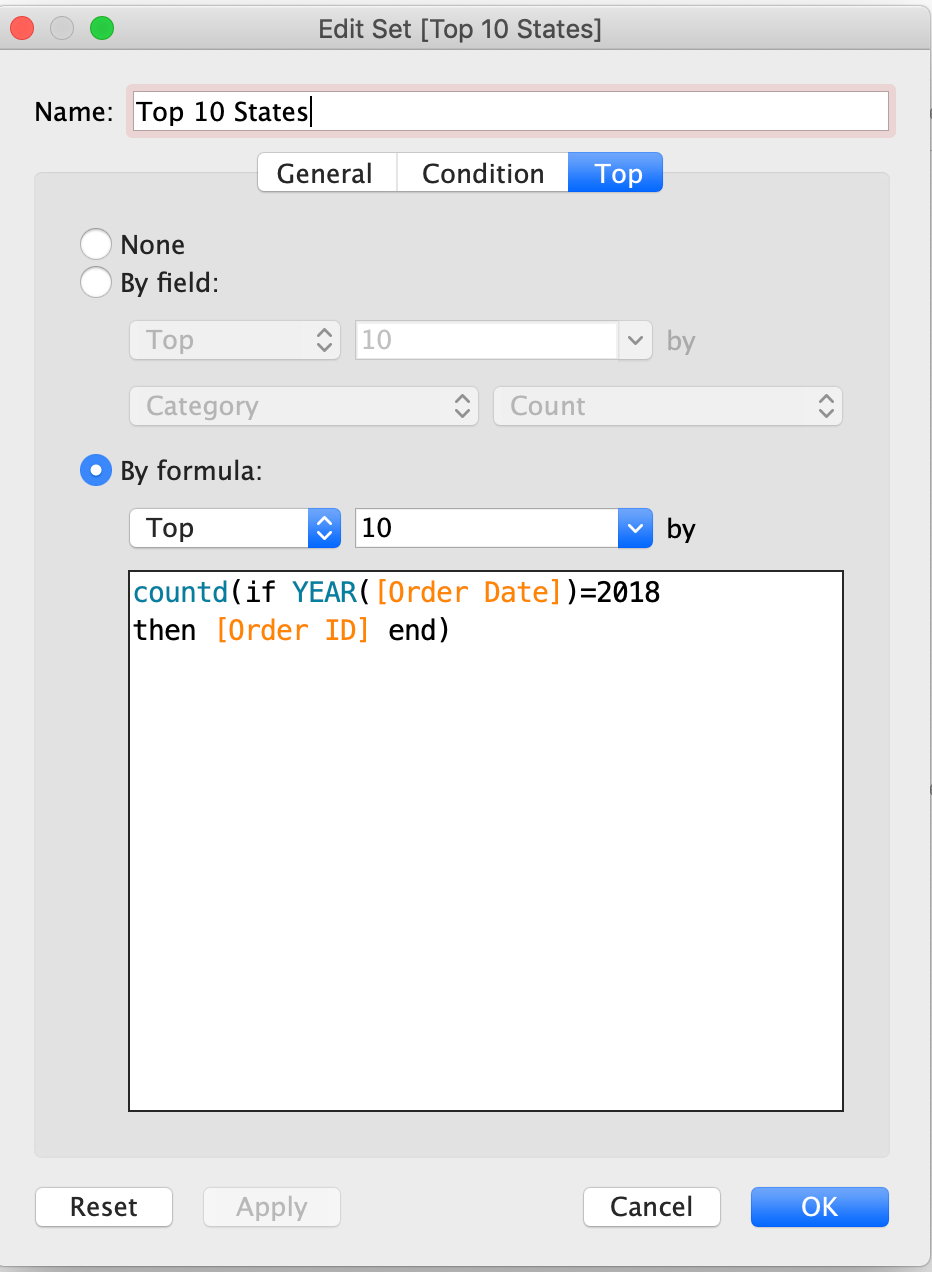
Now we can create the same set but set it to Bottom 5
Now let’s start building. First, let’s set our Category filter to “Furniture” and add it to context
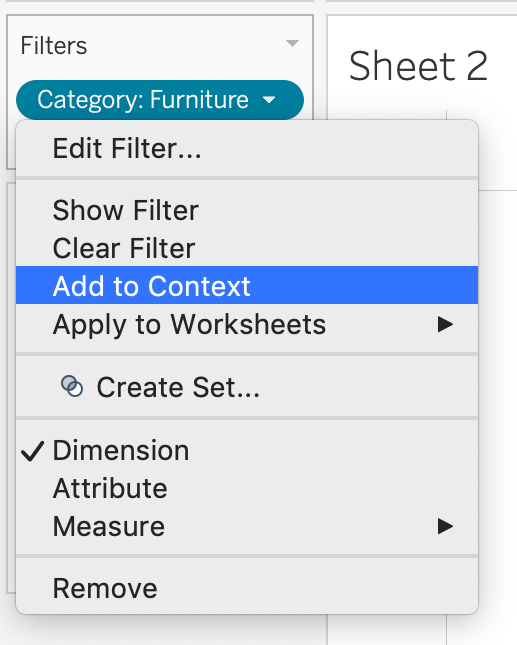
What does this do, you ask? Let’s take a slight detour to take a look at Tableau’s Order of Operations. That is, the order in which Tableau applies filters and aggregations when creating a view

As you can see, Sets are calculated BEFORE dimension filters. This means that currently the set is calculating the top 10 based on 2018 orders regardless of any dimension. Now lucky for us, Tableau gives us a way to manipulate the default order by allowing us to add any dimension filter to context. And as you can see, context filters happen before sets, which is what we want.
Okay now back to the worksheet. Now that we have separate sets we can use those create a top level dimension that will group states into buckets.
#Top Level Row#
IF [Top 10] THEN “Top”
ELSEIF [Bottom 5] THEN “Bottom”
ELSE “”
END
You might be asking yourself, “What’s up with the empty quotes? Why not just let that be null?” Well, it’s because Null is defined as “a missing or unknown value that doesn’t exist.” Nulls can be tricky to work with and sometimes you really want them to be null but in this case, we can get by with just empty text
Let’s drag this to rows and sort it appropriately

Now lets work on the next level, the actual state names along with the “Other” group. I like using sets so I’m going to stick with them
#Row#
IF NOT [Top 10] AND NOT [Bottom 5]
THEN “Other States (avg.)”
ELSE [State]
END
Let’s add that to rows as well, don’t worry we’ll deal with the sort in just bit.
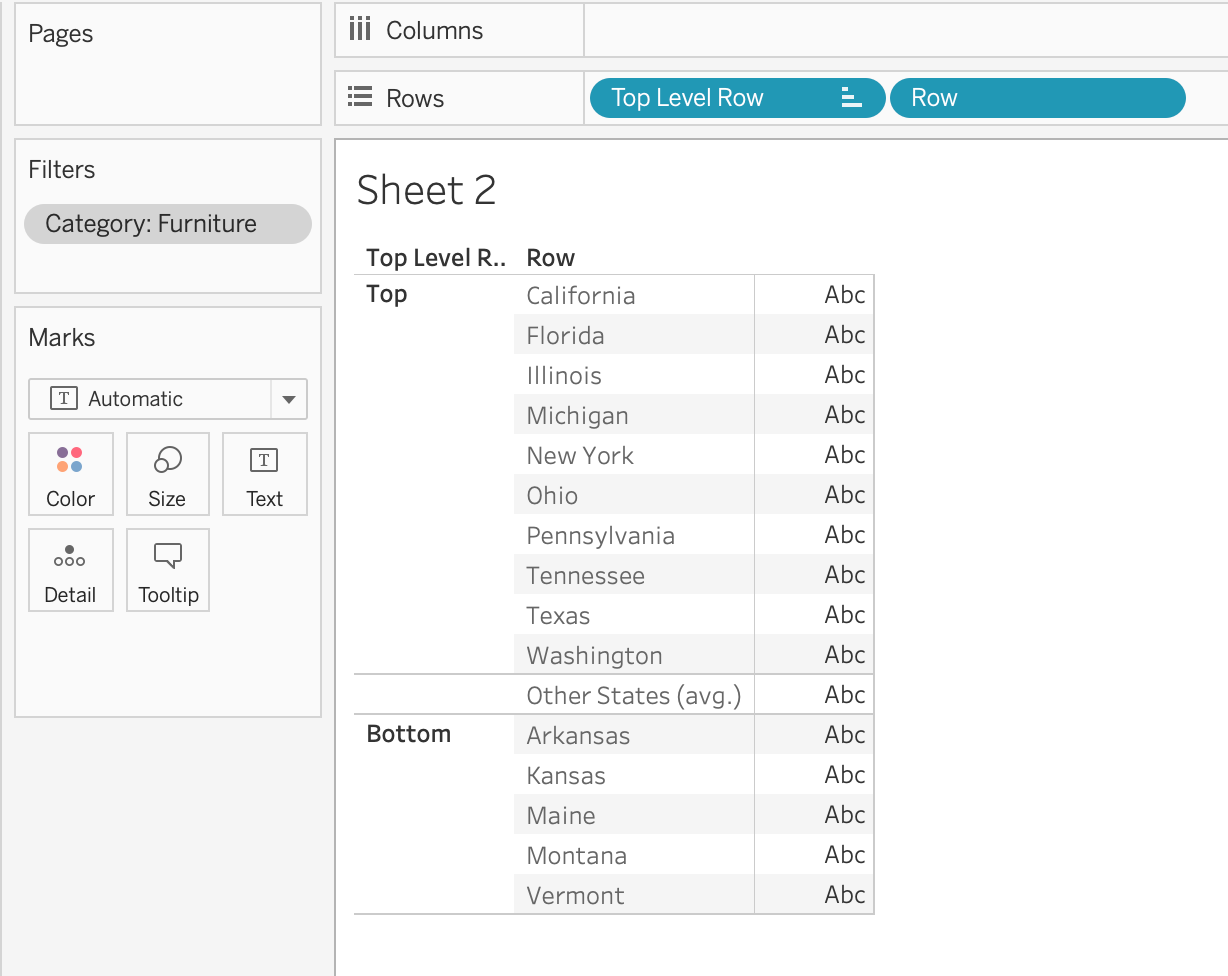
Now it’s time deal with the measures. This is gonna the trickiest part of the whole viz. We need to distinct count the number of orders for each state for each year. This is pretty straightforward but what about that “Other States” group. That needs to be the AVERAGE distinct count of all the states that fall into that group. Okay we can do this, check this out. Now, if you are a regular reader, you know that I prefer to write out each of my calculations but I’m making an exception because this a bit complex and the indentions really help make sense of it
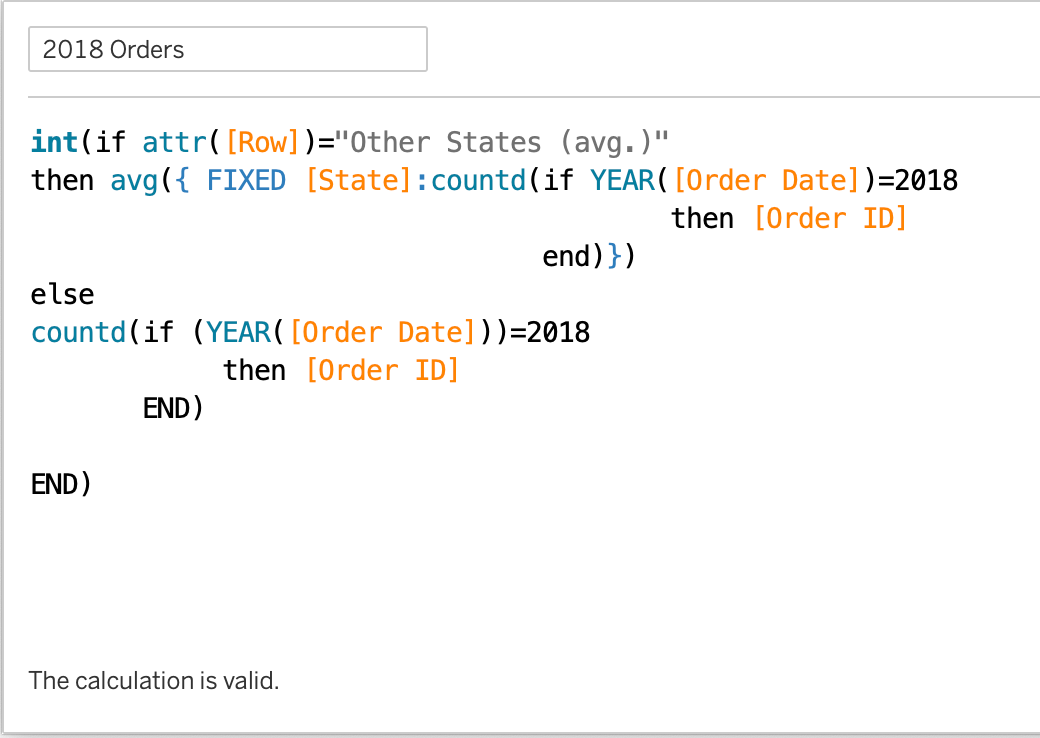
The most complicated portion of this is the LOD. So for each State in the “Other” group distinct count the order in 2018 AND THEN take the average of those values. I wrapped the whole thing in an INT() because when you take an average, you’ll likely result in a decimal number and for this purpose we’re not interested in decimals.
Now we’re just need do the exact same thing but change 2018 to 2017 in the title and the calculation. And now it’s time to add them to the view. Now remember up top, I mentioned that there are a couple ways to do bar in a bar charts; we can use a dual axis of both measure or we can use Measure Name/Values. In my original build I attempted both and found the dual axis to be a bit easier and quicker so that’s what I’ll show you here but I encourage you to try both approaches.
Now, we want the 2017 bars to be under 2018 so we’ll put [2017 Orders] out there first, then add [2018 Orders] next to it as a dual axis (don’t forget to synchronize) and finally change your mark type back to bars and you end up with…

Cool, now we can format our [2018 Orders] colors based on our [Top Level Row] and we’ll format 2017 colors to be a medium gray.

Now for the just fiddle with the sliders until you get them looking how you want. I wish I had a more technical answer for you but until Tableau gives us pixel amounts this is all we can do. And while we’re at it, we might as well format our lines and axis appropriately.
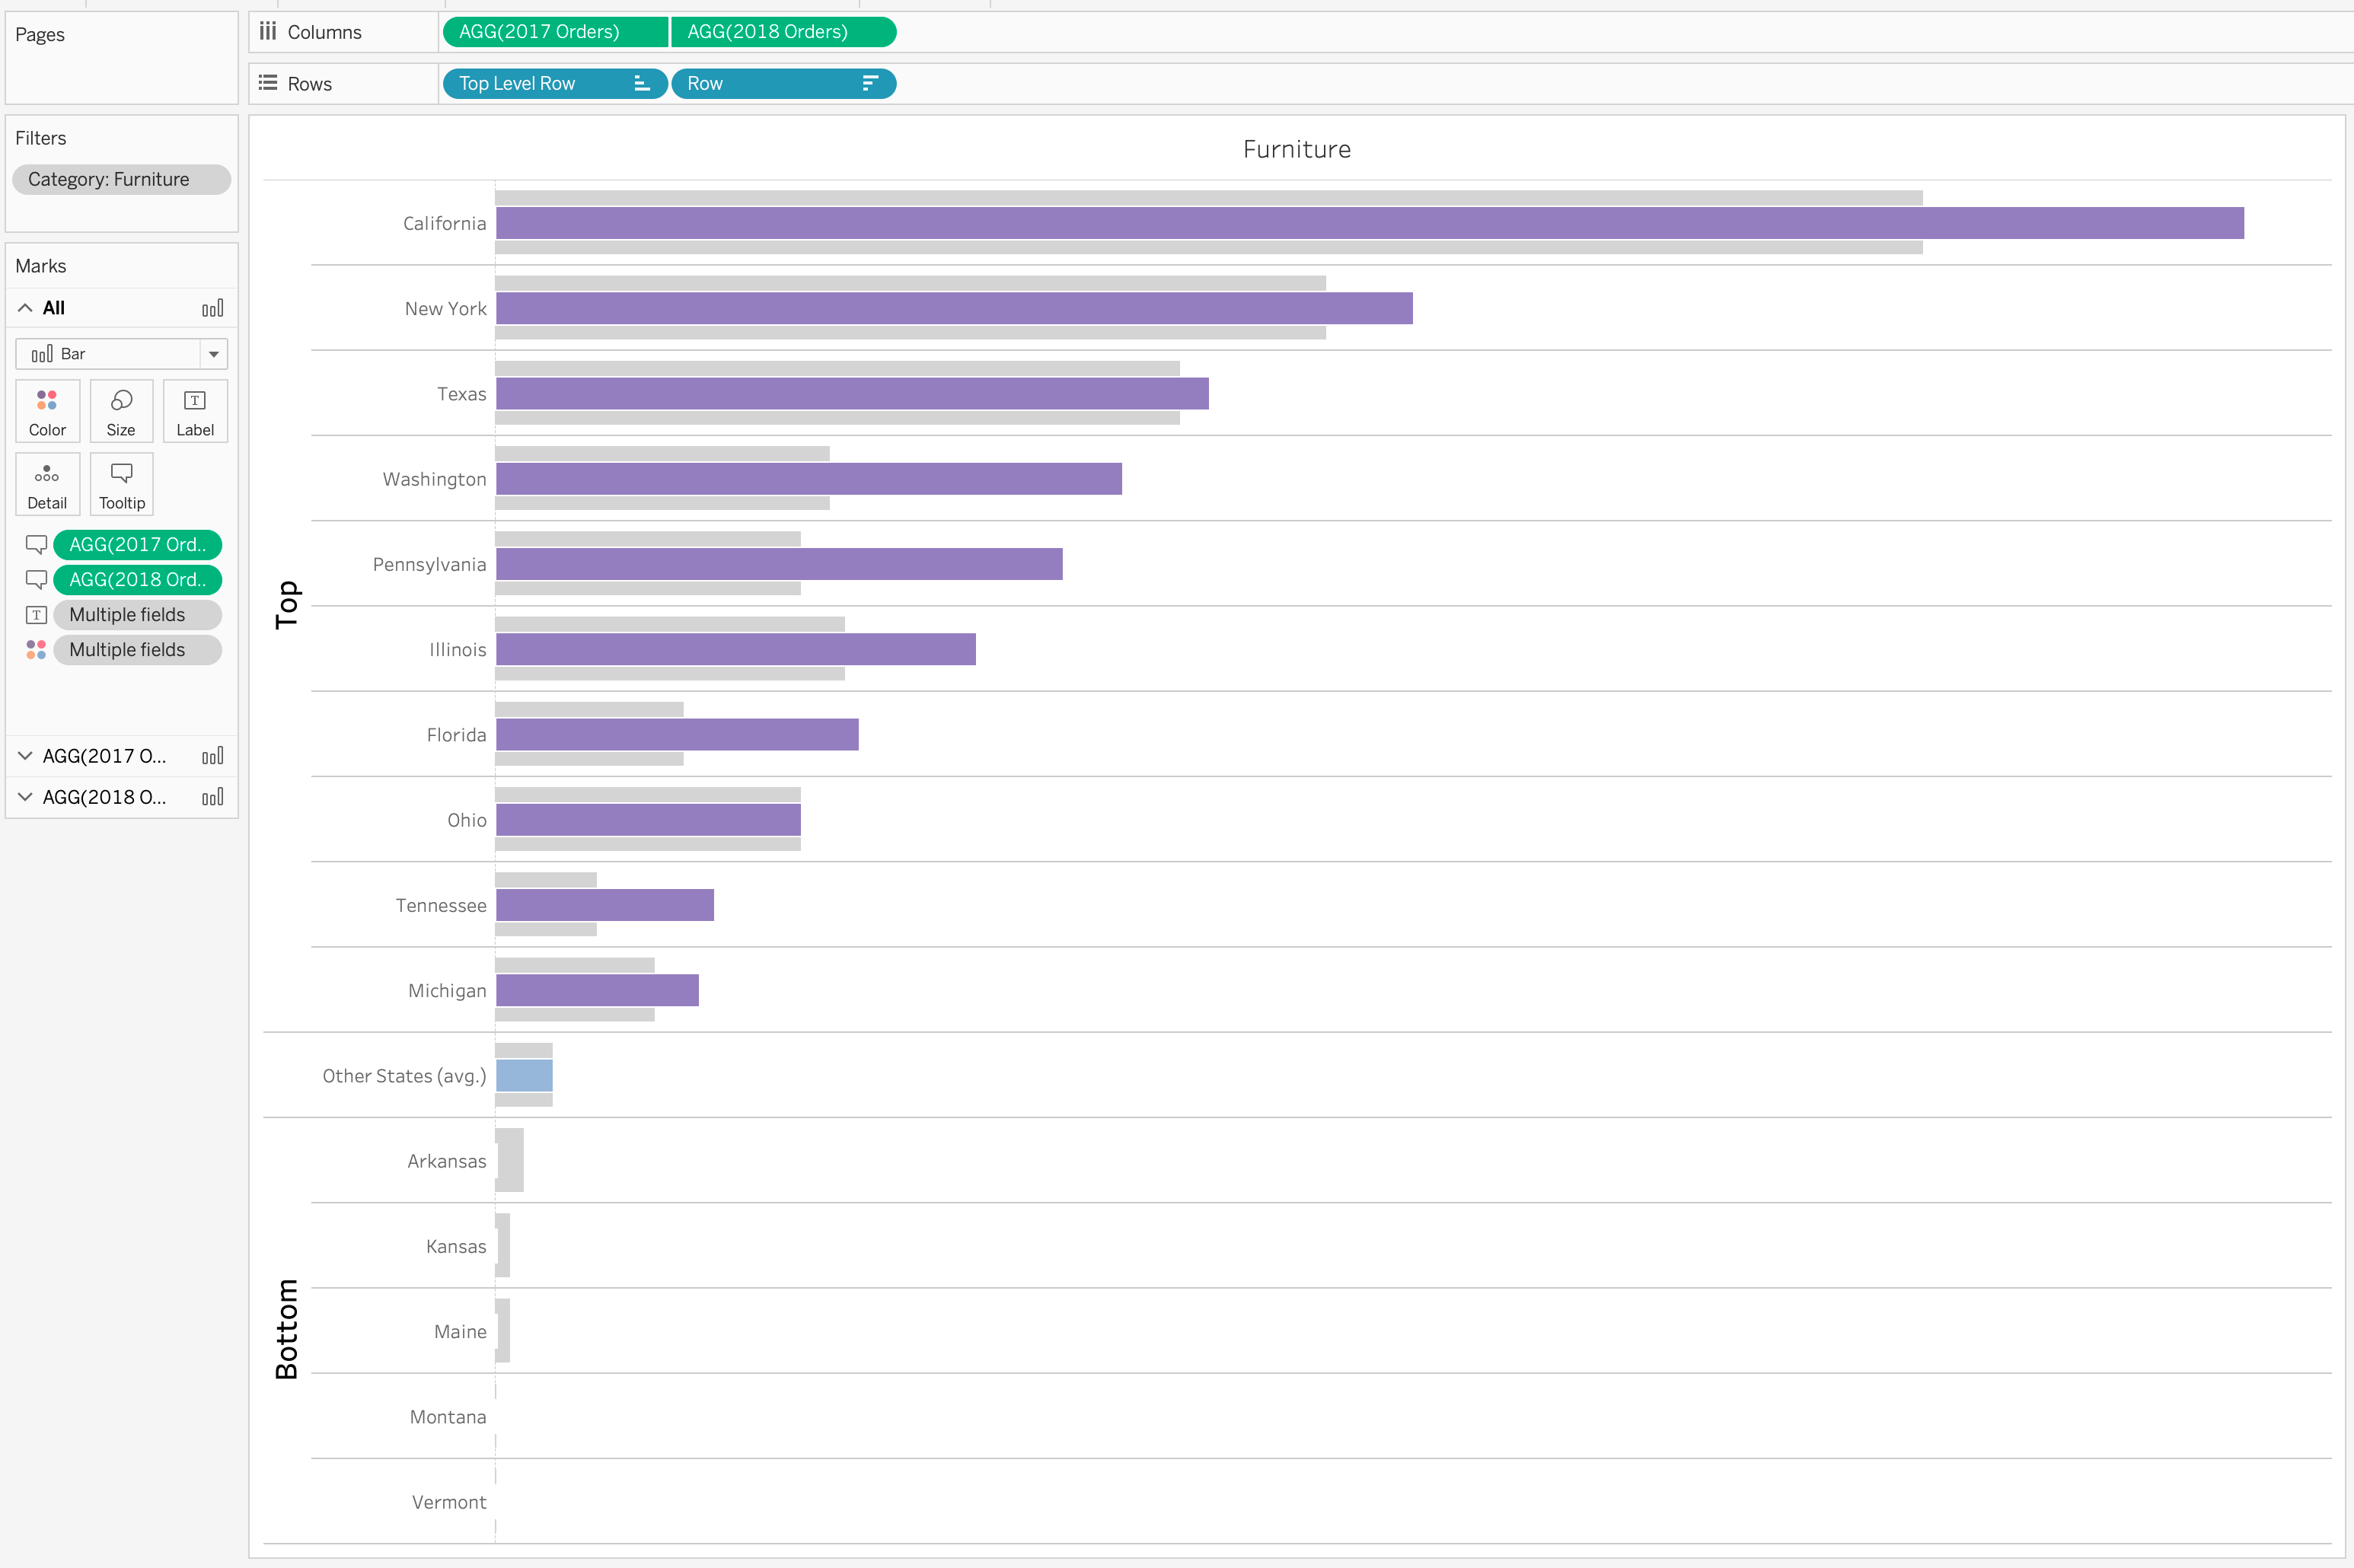
Now we just need to finish the mark labels and tool tips and we’re finished. The first thing that we’re gonna do is put our [2018 Orders] on the text shelf of the [2018 Orders] marks card.

that’s pretty simple, right? Now we need to also show the change from the previous year. that’s a pretty easy calculation
#Diff from LY#
[2018 Orders] – [2017 Orders]
Now, let’s talk about those arrows and one of my favorite tricks that I learned a while back. I could pretty easily create a calculated fields that evaluated our [Diff from LY] calculate and input a text field of these special characters. And that would totally work and be all good. Except that’s a lot of extra typing that we don’t NEED to do. We can simply manipulate the custom number format to achieve the same results.

When we click this we several default options and at the bottom we have this “custom” option. In this dialog, the world is our oyster, we can format anything we wish. If we know how to use it. Check this out
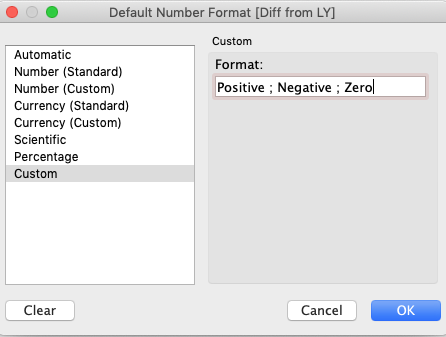
This is the basic structure. We can format our numbers differently based on where they fall on the number line. So in this case, we put our special characters right here in the right spot

So now, any time we bring this into a view, the arrow will be next to our numbers and anywhere there’s a 0 change, it will simply display “NC” without the number 0, which is pretty nice. I’ve used this for KPI call outs on some exec dashboards
Now we’ll take this field and also put this on the text shelf of the [2018 Orders] marks card. Then we can format this to the requirement. The last thing we need to do is get out tooltips in order, put it on a dashboard and we’re all set!
